Data From :
House Price Index (https://housepriceindex.ca/)
Historical Mortgage Rate (https://www.ratehub.ca/mortgage-rate-history-canada)
Graphs from : TREB(http://www.trebhome.com/)
HPI Data For Different House Type (https://www.crea.ca)
All data are able to use under acamedic and/or personal purpose only.
1.The reason of this report
I am considering buying a condo recently after working for years and North York or scarborough area with bus stop or subway nearby will be a good choice for me. I started to look at some condo information online and to my surprise, Toronto HPI(House Price Index) has increased dramatically recently, especially in last year(2017). I digged some data online and did this visualization report to show what is going on in Toronto House Market in recent years. All the information published here is from open source database and/or the result can be published online for academic and/or personal purpose only. Data resource has been listed above.
2.What I want to get from this report.
Firstly, what is the condo price predictive trend in next 3-12 months based on the data we have here.
Secondly, what are the key features to effect on house price, like locations, house size, mortgage rate, insurance and so on.
Thirdly,what is the relationship of ‘listing price’, ‘selling price’ and ‘listing days’. The relationship of this 3 variables can tell you how much money can you save when buying a condo. Unfortunately, the ‘selling price’ and ‘listing days’ data I got from sale representative is not allowed to published here.
3.Working Environment
Languages : Python 3.6.1
GUI : Spyder in Anaconda 3.2.8
OS : Ubuntu 16.04.4 LTS
Visualization : Tableau Desktop 10.5
4.Report
What is HPI ?
A house price index (HPI) measures the price changes of residential housing. In Canada, the New Housing Price Index is calculated monthly by Statistics Canada. Additionally, a resale house price index is also maintained by the Canadian Real Estate Association, based on reported sale prices submitted by real estate agents, and averaged by region. In December 2008, the private National Bank and the information technology firm Teranet began a separate monthly house price index based on resale prices of individual single-family houses in selected metropolitan areas, using a methodology similar to the Case-Shiller index and based on actual sale prices taken from government land registry databases. This allows Teranet and the National Bank to track prices without allowing periods of high sales in one city to push up the national average. The National Bank also operates a forward market on Canadian housing prices.(https://en.wikipedia.org/wiki/House_price_index)
Graph1 : 3 Main Cities Yearly HPI Comparison (Toronto, Quebec City, Ottawa)
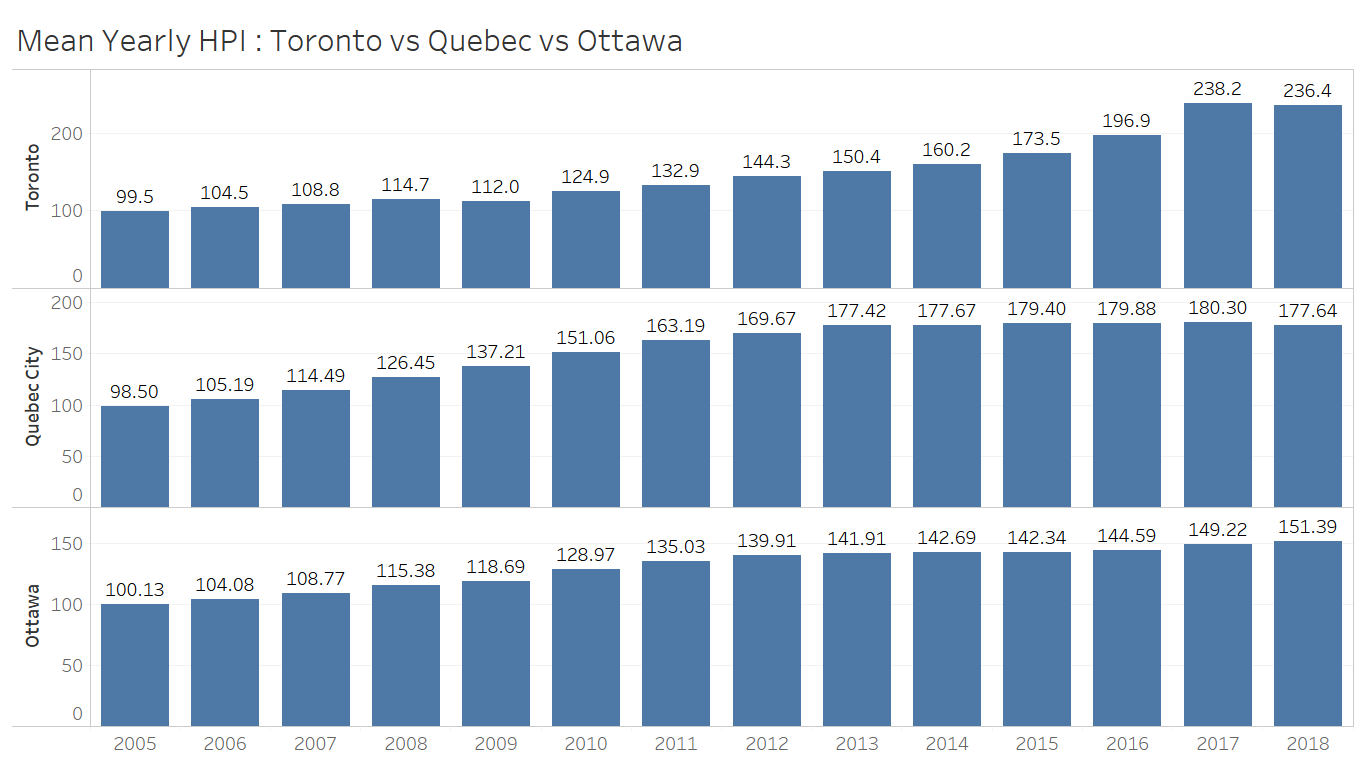
TThe trend of HPI for all cities seem to increase as time goes by, however, Toronto has a dramatically increase in 2017, which is more than 20% than last year(2016), while for other cities this dramatically increasing happened in 2009-2011. Generally speaking, the house price of Quebec City and Ottawa increased slower in last 13 years than Toronto.
Another Interest story I can find is that before 2011, HPI of Quebec City and Ottawa were higher than Toronto, while Toronto outstripped the others in 2016. In 2017, the annual increasing of HPI was 21%(238.2/196.9). This is something never happened before and may lead to adjustment of financial rules, such as make it harder to qualify for a mortgage, curbs on foreign purchases and rising interest rates.
In the first 3 months in 2018,however, things changed. HPI value of Toronto and Quebec City dropped by around 1-3%. This is not a notable value but it maybe lead to some kind of trend that house price in this two cities will drop in the future because of some political or financial methods applied.
Graph2 : Toronto HPI from 2011-2018 compared with Mortgage Interest Rate
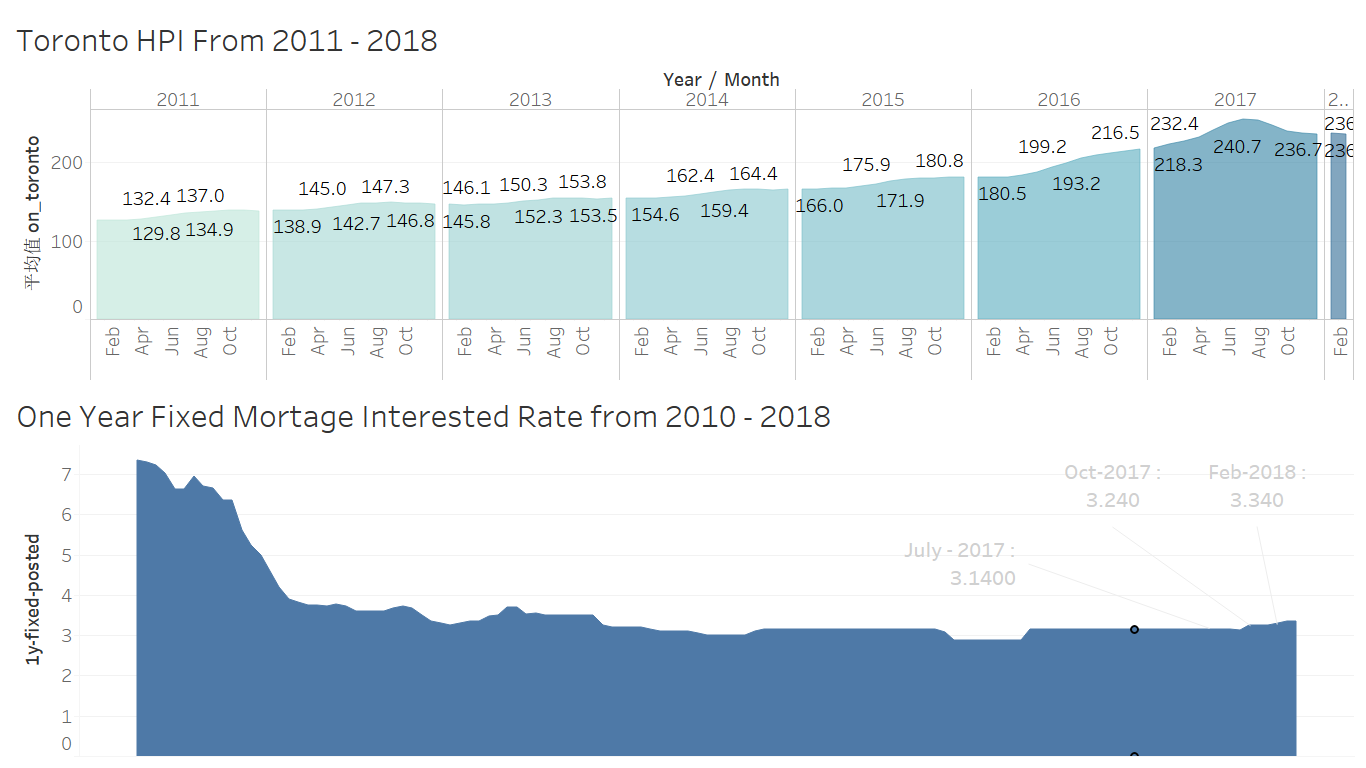
From first plot, we can easily find out that Aug of 2017 was the peak of all HPI graph, with the value of 240.7. And from the second plot, we know the reason of HPI value dropped after that is the changing of mortgage interest rate. In July 2017, the mortgage interest rate was 3.140, which is same with value of 2013, however, in that 4 years, HPI of Toronto increased more than 40%.
In another word, is suggests that Canada government didn’t do anything in mortgage rate to limit the house price in last 2 years and to some extent, this leads the out-of-control of Toronto house market now. In Oct-2017, mortgage rate increased, which made HPI value drop dramatically, even considering the influence of seasonal time series.
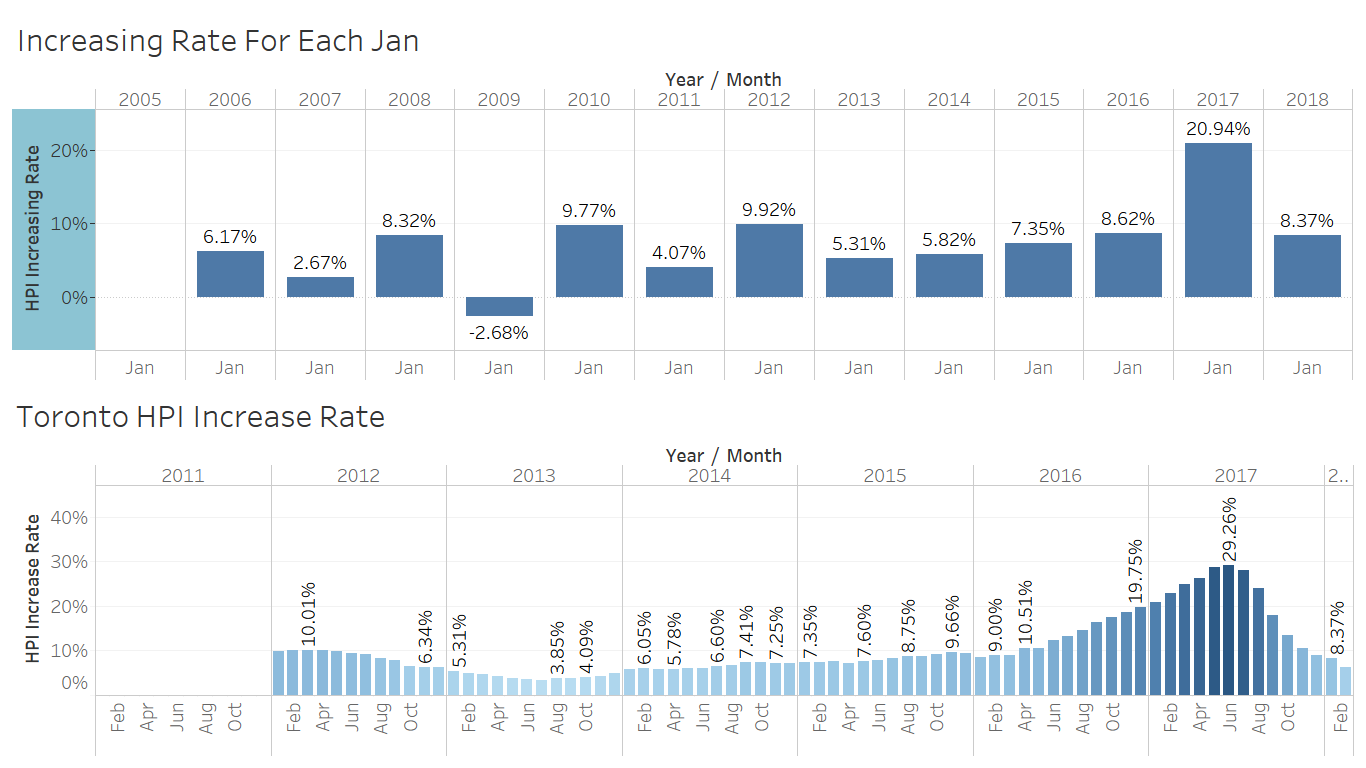
In Jan-2018 HPI increased around 8%,compared with Jan-2017, and maintained the same level with last month(Dec-2017). However, monthly increasing rate was dropped dramatically(Graph3), which means although the house price still increased, but not as sharply as before (20.94% vs 8.37%).
Graph3 : Increasing Rate For each Jan and Monthly HPI increasing rate
Graph4 : Price of Different Types Houses vs Mortgage Rate
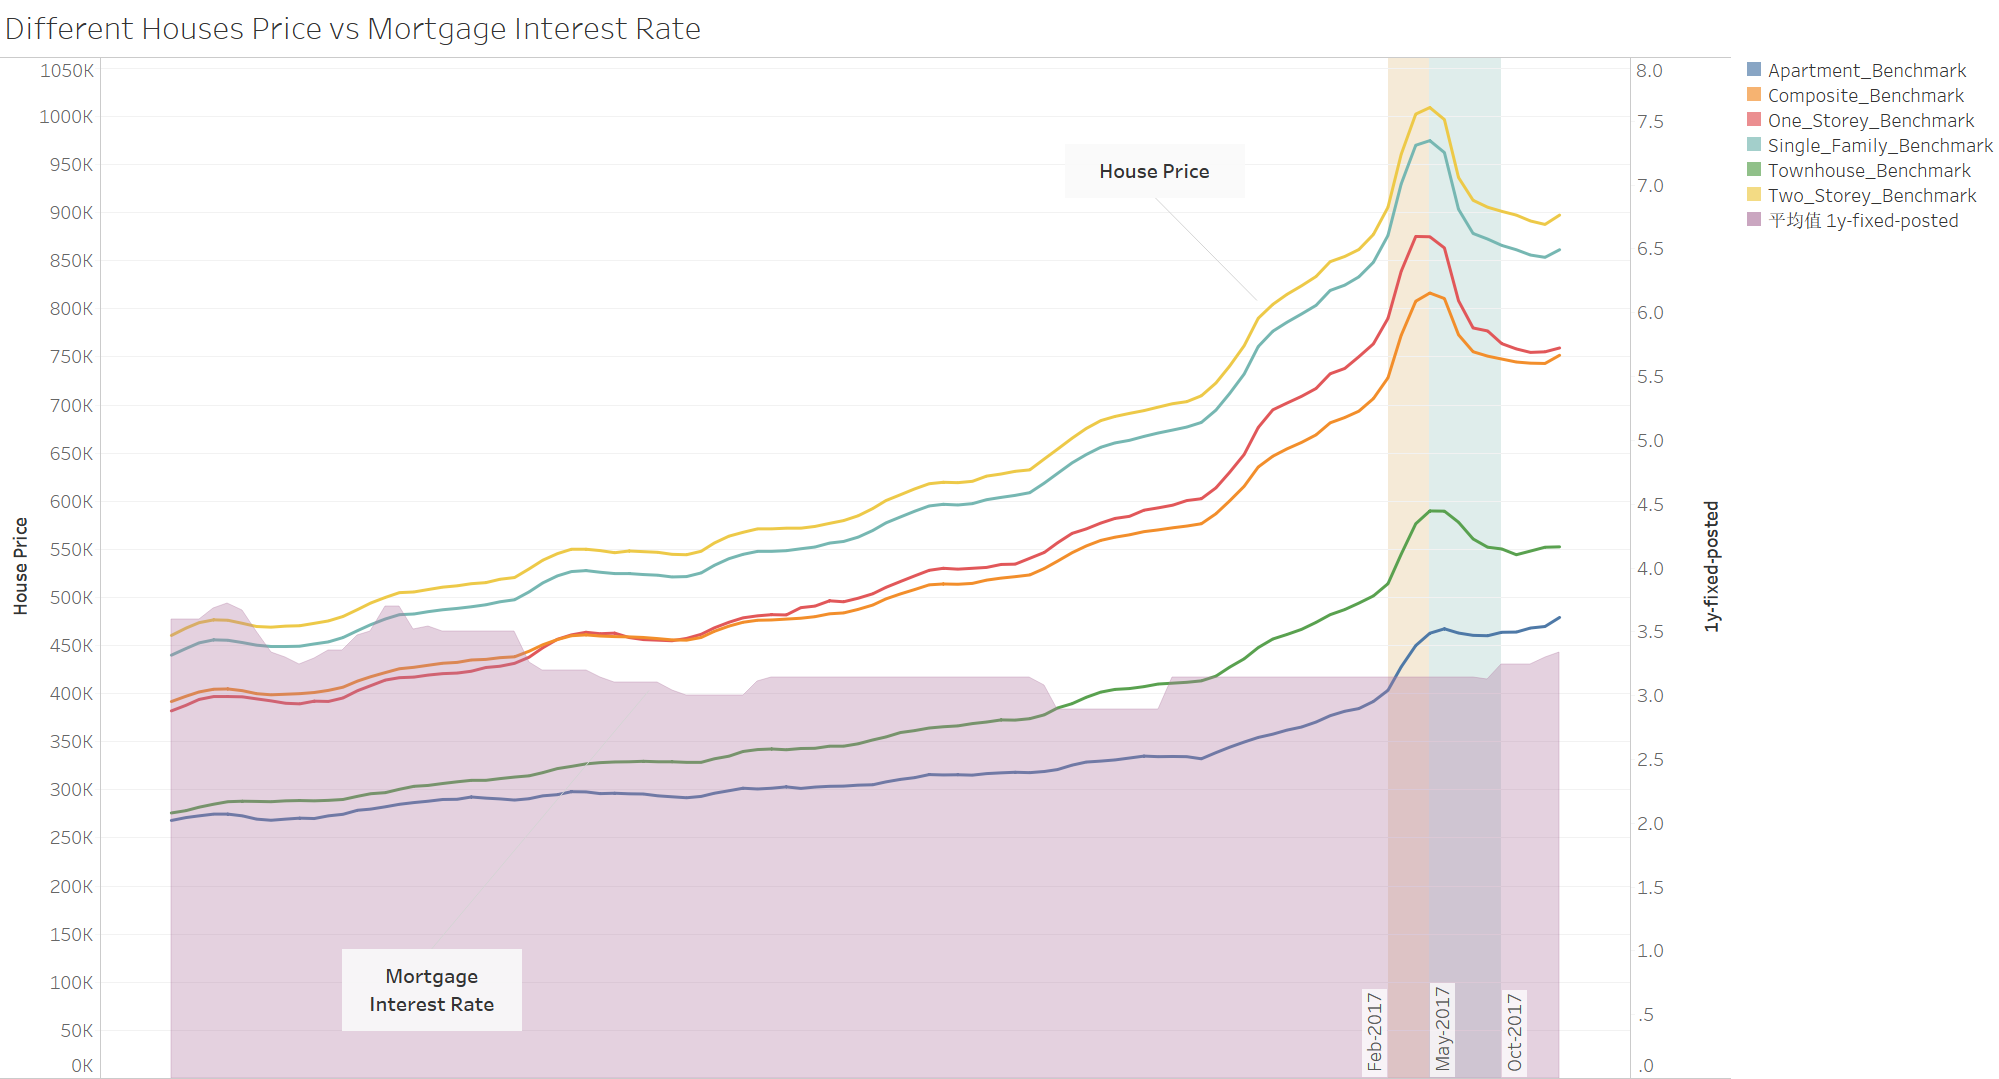
From graph4, we see that peak of price of all types of houses was around May-2017, and then price seemed to drop while condo price continuous increased although not so dramatically as before. This is not a good news for the ones who want to buy apartment/condo recently since the financial methods didn’t work on them. On the other hand, for other types of houses, price started to increase again somehow since Jan-2018. To some extent, it shows that the financial strategies didn’t work as expected.
I also label 3 time points, Feb-2017,May-2017,Oct-2017.
On Feb-2017, CBC and other medias started to report that centre bank had plan to increase the mortgage rate and immediately, then house price increased like insane in next 3 months since it’s hard to qualify for a mortgage and need to pay more. After that, on May-2017, price dropped down since more and more people refused to buy and/or can’t afford houses. On Oct-2017, since the mortgage finally increased, house price dropped as before, but the trend was slower and gradually, price stopped dropped on Dec-2017 and increased again.
Graph5 : Estimated HPI and Price
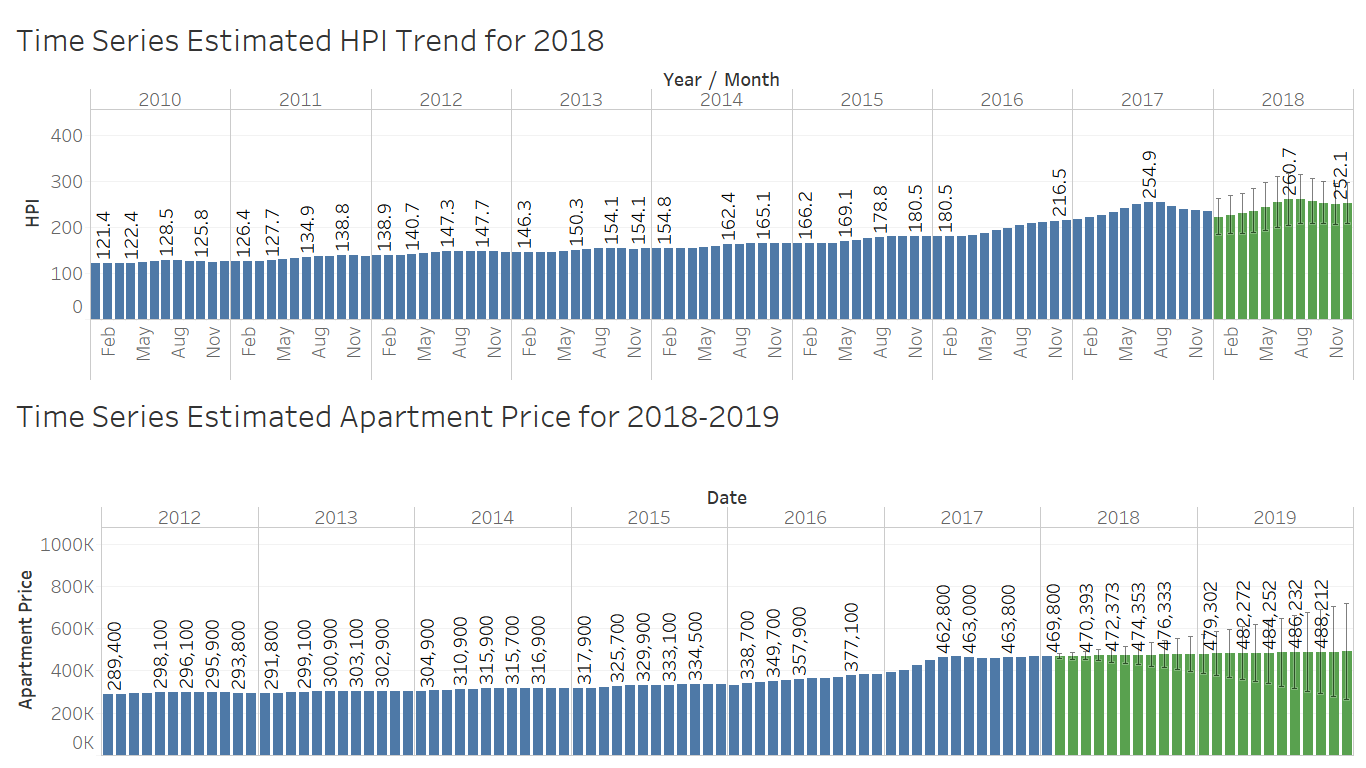
Based on time series, we know that HPI will increase continuously in 2018 and peak at July and August. So for recent house buyers, I highly recommend to finish everything before April. While in other hand, apartment price will increase gradually and slightly and the increasing of mortgage will still not work on it. So for recent condo buyers, the earlier the better. Notice that this is just basic regular prediction without any influence of others, such as limit the number of houses each people can buy, the amount of mortgage and so on. But no doubt that, the price of Toronto house will still increase until more financial and political methods will be applied.
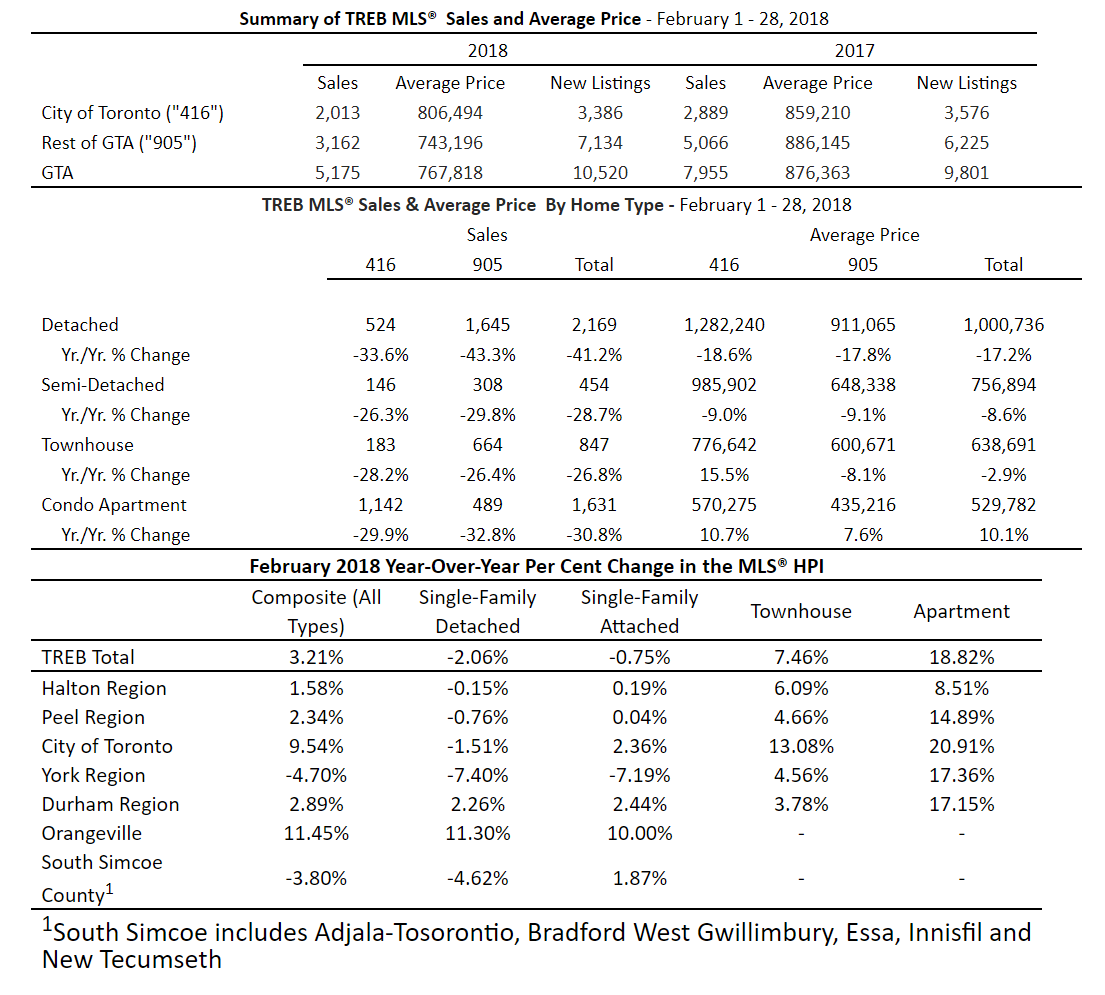
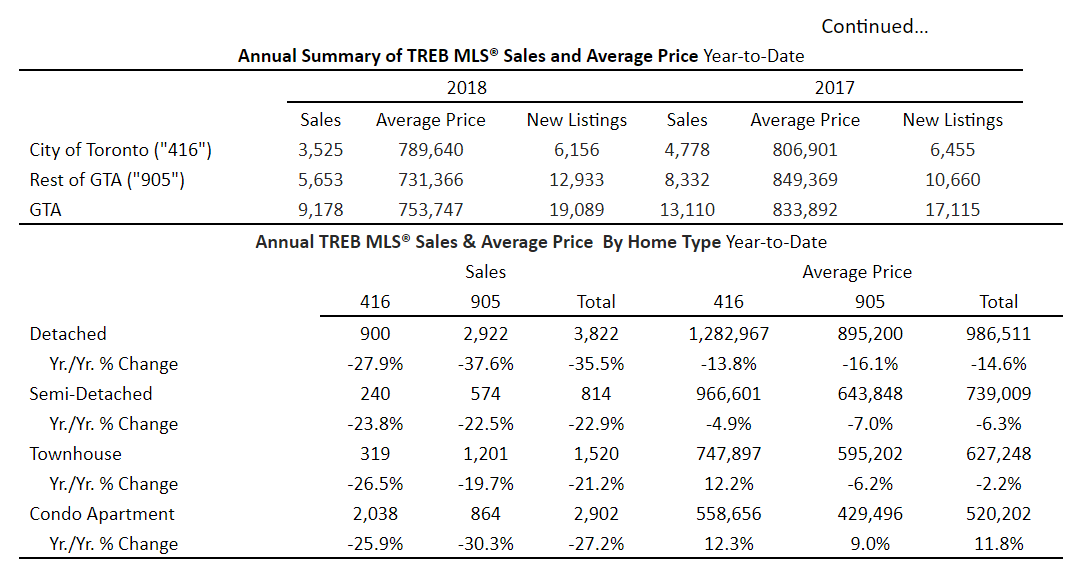
Graph6 : Some details numbers in 2018 coming from TREB(http://www.trebhome.com/market_news/release_market_updates/news2018/nr_market_watch_0218.htm)
